Delta Wealth Solutions Strategy Lab
Welcome to the Strategy Lab. The Delta Wealth Solutions Strategy Lab focuses on providing the necessary insights to help clients achieve optimal investment and planning outcomes. Please check back regularly for our quarterly market newsletter along with commentary on the stories that move markets.
January 2026
Delta Strategy Lab - Market Update
The Good Old Days
Many individuals and businesses use the start of a new year as an opportunity to set new goals. Goals are wide ranging, individuals might want to learn a new skill or drop that last five pounds. Businesses might want to grow revenues or increase service. The Chiefs might just want to make the playoffs again! Regardless of the source of the goal, these goals often times are seemingly important and something difficult to do, otherwise it would already be done. What’s fascinating, and probably the reason why almost 80% of new years resolutions fail by February, is that goals require a process. Simply stating that someone wants to learn to play the piano is just a statement. Taking that goal and signing up for lessons, allocating time and money to the task are what will actually help achieve the goal.
Investors are no different than our friends trying to learn piano or drop those pesky five pounds. For most investors, the goal of investing might be summed up as long term financial success. This is a difficult and purposeful goal indeed! It will take years of compounding good financial decisions, hitting savings targets, and executing a portfolio management strategy. Simply stating one would like a successful retirement without putting in the years of financial stewardship would be impossible. In the investing world, investors don’t have the ability to achieve such a goal in just a year. Budgeting might be a new years resolution, but long term financial success will be completed over decades. Delta Wealth Solutions executes this process on behalf of its clients. Identifying needs, and implementing a plan to account for those needs, will help investors achieve long term success and not fall into the 80% camp who miss out on new years resolutions by February.
Where do I stand with my financial plan?
Despite a tumultuous period around the tariff roll out, investors saw capital appreciation in most equity and fixed income segments throughout 2025, with the S&P 500 and the Bloomberg U.S. Aggregate Bond Index both notching significantly positive returns. The question becomes, “Now what?” Let’s look at these two asset classes further. In the fixed income market, the Federal Reserve has entered a rate cutting cycle and come May 2026 a new chairman will likely continue that trend. In this case, as rates move lower investors could see price appreciation. Second, for equities, Phil Rosen recently noted, “The recent push to new highs has been broad based, with small cap stocks and the equal weighted S&P 500 rallying along side the usual suspects across big tech. That breadth implies healthy participation, not narrow and exhausted leadership.”1 The impetus of this statement is to show how equity markets appear healthy and not exhausted. Indeed, just as an investors goal doesn't reset at the beginning of the year, the process of portfolio management and financial planning continues without end. Delta Wealth Solutions will rebalance as needed and execute portfolio updates if and when market conditions make it prudent to do so.
"Everyone has the brainpower to make money in stocks. Not everyone has the stomach." Peter Lynch
The Good Old Days
In the series finale of the Office, one of the main characters, Andy Bernard, says the line “I wish there was a way to know you’re in the good old days before you’ve actually left them.” This line can be applied to many things, life, Chiefs fandom, etc. In our line of work it certainly applies to the investing world. The S&P 500 capped off its third straight year of double digit returns, rising 17.9% when including dividends. To take it a step further since the start of this secular bull market in 2009 the S&P 500 has appreciated 926%2 . At any point in time I don’t think anyone would argue it felt like smooth sailing. 2011 experienced the Greek Debt crisis and the S&P 500 fell 20% on the US government debt downgrade. 2015 and 2016 had back to back years of double digit corrections where the S&P had trivial positive returns. 2018 investors experienced a 20% drawdown on Christmas Eve following concerns about the Federal Reserve hiking rates too fast. Lastly to drive the point home, in 2020 investors experienced a 35% drawdown and in 2022 another 27% selloff. In any given moment it wouldn’t feel like investors have been experiencing the “Good Old Days,” but when zooming out US investors have had nearly two decades of rapidly increasing real wealth due to rising stock prices. In our view, there is likely more room to run in this secular bull market, but with that said investors should know these times won’t last forever and it’s important to take advantage of these times when they’re available.
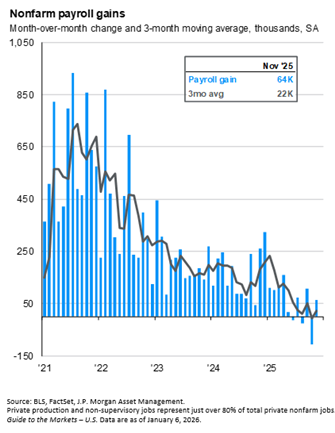
Since the onset of the Covid-19 pandemic the labor market has been a significant point of intrigue and rightfully so. The labor market is a direct driver of consumer spending and the economy, meaning when employment is strong it generally bodes better for markets and profitability. During the pandemic recovery monthly employment gains averaged in the hundreds of thousands. Over the last 3 months job growth has only averaged 22,000 jobs added per month3. While some pundits will sound the alarm saying this is indicative of an economy entering recession, we would disagree. Over the last decade there has been a major structural shift in the US, specifically less babies are being born. From 2010-2024 both legal and illegal immigration largely carried the burden of increasing the labor pool. Right or wrong, the current administration has significantly decreased the total amount of immigration coming into the United States. As a result, there aren’t enough people to continue growing the job market by hundreds of thousands of jobs a month. It’s much more likely the labor market only needs to grow by 30,000 to 50,000 jobs a month to maintain full employment. As long as the employment economy continues in a low-hiring low-firing type of environment, the economy should continue on its low growth moderately low inflation trajectory.

It's Always about the Oil
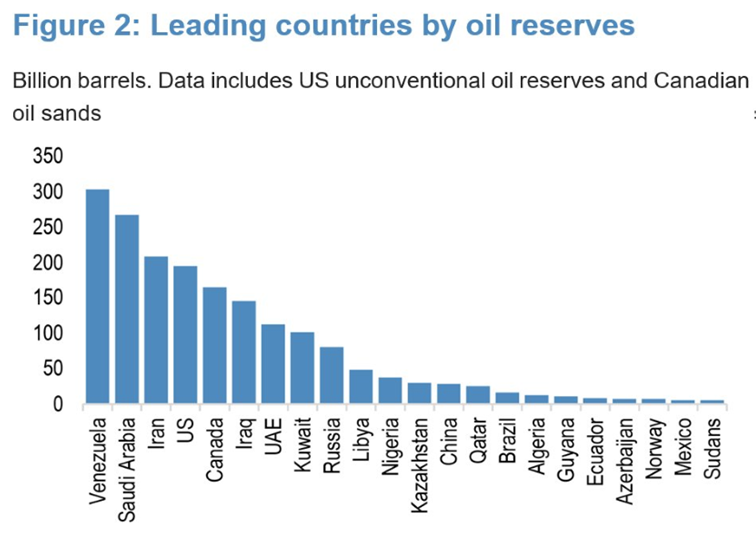
Shortly after the new year many of us woke up to the same surprising news, US forces had captured Venezuela’s controversial leader Nicholas Maduro. We’ll leave the debate around this to the media, but it is worth exploring the consequences on US energy policy. Recently it’s estimated Venezuela has been producing ~1mm barrels of oil per day4, well below the ~3mm barrels per day produced before Nicholas Maduro took power in 2013. The oil that is produced is mostly placed under US/EU sanctions stemming from human rights abuses, corruption, and alleged financing of terrorism. Recently Venezuelan authorities have been circumventing sanctions and selling oil to China at below market prices. If removing Maduro gets the remaining Venezuelan authorities to give into US pressure it is reasonable to assume the 1mm barrels per day will now be released to the market, and that oil needs to be refined by someone, likely US energy companies in the Gulf of Mexico. This can benefit the US potentially by further exerting the global oil market under US influence and reduce China’s ability to purchase below market price energy. It remains early days in the country’s transition. No doubt there will be numerous twists and turns before it’s settled on Venezuela’s path forward.

Earnings Driving Majority of Markets Returns
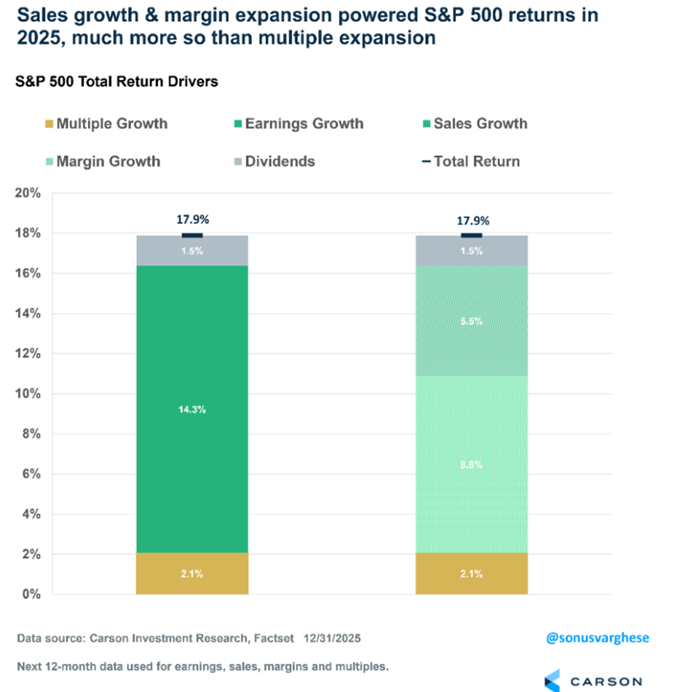
Now that 2025 has fully drawn to a close we have most of the data to sort through. Last year the S&P 500 rose 17.9%. Many pundits are highlighting these returns aren’t sustainable and unjustified. Beneath the surface the numbers tell a slightly different story. Last year, 1.5% of the S&P 500’s return came from dividend payouts, 5.5% came from sales growth, and 8.8% from increased margins (productivity gains and cost cuts). Only 2.1% of the 2026 return came from multiple expansion which would be considered unsustainable. Long story short 88% of the S&P 500 return last year came from fully justified measures.
5 Over the last 5 years the market tells a very similar story. The starting forward P/E in 2021 was around 22x the next twelve month expected earnings, as of this writing the market sits at 22.3x earnings. It may not last forever, but market participants have largely become comfortable with the S&P 500 trading at higher than historical multiples.

One reasonable assumption on why this could be comes down to the current makeup of the S&P 500. In 1980 most companies in the index were manufacturing based, requiring much more capital to undertake projects at lower expected returns. Fast forward to 2025, only 17% of S&P 500 companies are manufacturing and the new majority centers around “Innovation” type of companies6. More simply put, technology and communication services companies. These companies rely more on intangible assets than large factory buildouts and generally generate higher return on equity and return on assets.

Process, Process, Process.
Writing this at the beginning of 2026 and no one knows exactly what’s in store for investors this year. Investors should be prepared for most anything. Mid term election years are almost always more volatile than most. We have said it time and time again, we will never bet our clients financial future on our ability to guess. Though we do believe the bull market will continue, now is not the time for any all-in bets in either direction. In our view, investors should continue to follow their process and enjoy the “Good Old Days” while we are in them.

Disclosure: Indexes shown: S&P 500 Value, S&P 500 Growth, S&P Mid Cap 400, S&P SmallCap 600 Growth, S&P SmallCap 600 Value, ICE BofA High Yield Bond Index ETF, Bar-clay's Aggregate Bond Index, MSCI World Index ex. US, S&P 500 Real Estate, and Morgan Stanley Capital Index Emerging Markets. This is not an official representation of your asset allocation. The percentages shown were calculated manually and could be subject to transcription error. Your official record of your asset allocation is shown on your official statement from Charles Schwab. Past Performance isn’t indicative of future results. *Performance Date as of 12/31/2025
1. Rosen, Phil. “Stock Market Outlook: Why S&P 500 Is Set to Break Records before Year-End.” Opening Bell Daily, Opening Bell Daily, 18 Dec. 2025, www.openingbelldailynews.com/p/stock-market-outlook-sp500-investors-seasonality-wall-street-fed-rate-cut?utm_source=www.openingbelldailynews.com&utm_medium=newsletter&utm_campaign=here-s-why-stocks-look-set-to-break-records-before-year-end&_bhlid=19567052918a1b6af0901962f5c546a29385bab6.
2. Yahoo Finance. S&P 500 performance from March 9 2009 through January 6 2026.
3. Kelly, David—JP Morgan Guide to the Markets Page 18 8 January 2026
4. Saefong, Myra P. “Here’s How Much Oil Venezuela Is Producing and Exporting .” Marketwatch.Com, x.com/MarketWatch/status/2009058888239255891. Accessed 9 Jan. 2026.
5.“Market Outlook 2026.” Carson Group, 9 Jan. 2026, www.carsongroup.com/market-outlook/.
6. Bank of America Global Research 31 December 2025
This commentary on this newsletter reflects the personal opinions, viewpoints and analyses of the Delta Wealth Solutions, LLC employees providing such comments, and should not be regarded as a description of advisory services provided by Delta Wealth Solutions, LLC or performance returns of any Delta Wealth Solutions, LLC Investments client. The views reflected in the commentary are subject to change at any time without notice. Nothing on this website/newsletter constitutes investment advice, performance data or any recommendation that any particular security, portfolio of securities, transaction or investment strategy is suitable for any specific person. Any mention of a particular security and related performance data is not a recommendation to buy or sell that security. Delta Wealth Solutions, LLC manages its clients’ accounts using a variety of investment techniques and strategies, which are not necessarily discussed in the commentary. Investments in securities involve the risk of loss. Past performance is no guarantee of future results. Delta Wealth Solutions, LLC a Registered Investment Adviser. This newsletter is solely for informational purposes. Advisory services are only offered to clients or prospective clients where Delta Wealth Solutions, LLC and its representatives are properly licensed or exempt from licensure. Past performance is no guarantee of future returns. Investing involves risk and possible loss of principal capital. No advice may be rendered by Delta Wealth Solutions, LLC unless a client service agreement is in place.
The hypothetical information provided is back-tested performance, was compiled after the end of the period described and does not represent decisions made by Delta Wealth Solutions, LLC.
Specific note concerning graphs, images, charts, formulas, or any other visuals: Delta Wealth Solutions, LLC provides such exhibits for informational purposes only and the data provided alone should not be considered investment advice and should not in and of itself be used to determine which securities to buy or sell, or when to buy or sell them. Any graph, image, chart, formula, or visual should be only be considered in its specific context within this newsletter and from the original source where it is derived. Any use of a graph, image, chart, formula, or other visual is not a solicitation to buy or sell securities in any manner. Any investments should be considered thoroughly and discussed with the readers Financial Advisor.
This publication has been prepared by Delta Wealth Solutions LLC and may not be reproduced or distributed without the consent of Delta Wealth Solutions LLC. This document is for informational purposes only and is not an offer, or solicitation, to buy , sell or hold any financial product or investment. The analysis contained within this publication should not be considered a recommendation and does not take into account the specific goals, objectives, or needs of any recipient. Past performance is no indication of future results and different assumptions could create results that materially alter from the information conveyed in this publication. The opinions and information conveyed within this publication were procured by sources deemed to be reliable. This report is up to date as of the date and time reported on page 1 of this publication.
More information about Delta Wealth Solutions LLC can be found on our website at www.deltawealthsolutions.com, calling us at 816-810-4467, or e-mailing info@deltawealthsolutions.com. Delta Wealth Solutions is a Registered Investment Advisor in the State of Missouri.


